Monday, November 13, 2023

Trade in the direction of strenght

 It is better to trade in the direction of strength than to bet against it. 


What do I mean by that? Let`s use as an example a trade on NATGAS


Daily chart


A beautiful candlestick set-up after a retracement in a stage 1 accumulation phase of the market. The stage one seems to be transitioning into the stage 2-uptrend. A great time to establish long positions.

- If you do not have experience in trading NATGAS, consider using a demo account. 


4 Hour chart


15Min chart


To enter the NATGAS market long, I had to see some underlying strength in that direction. Only after the market cleared the 3.084 level, I start looking to enter the market long.


I entered when the very tight consolidation started resolving itself higher. The 3.084 level was used as an initial stop-loss. Shortly after entering the trade, I was able to move the stop-loss to B/E.

The break-even point is the sweet spot, and it is important for a trader to use it. It infinitely improves the risk-to-reward ratio. 


Life`s wisdoms
It is better to have less and keep it than exposing your capital to an excess risk. 


Thursday, January 5, 2023

AUD/USD Trade

It has been a while since my last post. Hope you have been missing me guys:)!

I have decided to change the format of my blog a bit. I will be sharing with you my real-time trades. In this way, It will be easier for you to grasp some of the trading concepts discussed in previous posts. 

Currently, I have a long position in AUD/USD.


Aword of caution! It is important to keep in mind that we are dealing with probabilities. There are no certainties in trading and no one knows where the market is going. If you look for certainty in life, you better stay away from this craft (trading). Also, do not trade money you cannot afford to lose. 

Start small!!! 

So let´s get down to business..... 

From a long-term chart, we can expect AUD/USD to move higher. The weekly chart has just gone through a rather deep retracement after the break of major resistance (BMR), which took place in 2020. The BMR suggests a changing trend in the pair and we could be at the beginning of a long-term uptrend. We will see on this one:)!

 If we are dealing with a trend change, we need to accommodate our trading style to this new market environment. All we have to do is to buy price corrections and continuation patterns. 

 I have placed my limit order at 0,7113, which I consider an area of significant resistence. If the price moves to my limit, I will take my profits and watch the subsequent price behavior to initiate new trades. 


In case the current consolidation does not resolve in a move higher, I have placed a protective stop. The stop limits my total loss on this trade to no more than a fraction of my total equity. I will delve into the risk management part of trading in another post. 

A recommended reading: Fooled by randomness by Taleb.


Tuesday, April 19, 2011

7. Support and resistance

Greg Capra founder of Pristine trading school said: “Price is the only truth in technical analysis”.  I tend to agree with him. All other indicators are derivatives of price and cannot give you more meaningful information than price alone. In order to read price information correctly, it is crucial to understand the concept of support and resistance. In a nut shell, support is a price area on a chart, where demand is and resistance is a price area, where supply is located. Support and resistance are areas that represent commitment with real money. At support, buyers anticipate overcoming sellers and vice versa. There are 3 levels of support and 3 levels of resistance.


3 levels of Support
1. First level of support is previous bar`s low.
2. Second level of support is minor Support (mS): area of overlapping bars directly to the left of current prices.
3.Third level of support is Major Support (MS): it is a pivot low: bar with higher lows on both sides. Major support develops only after a prior high is overcome. 

Same applies to resistance in reverse:

3 levels of Resistance
1.First level of resistance is previous bar`s high.
2.Second level of resistance is minor Resistance (mR): area of overlapping bars directly to the left of current prices.
3.Third level of resistance is Major Resistance (MR): it is a pivot high: bar with lower highs on both sides. Major resistance develops only after a prior low is overcome.


Understanding support and resistance is helpful in determining correctly current market stage. For example, stage 2 uptrend is characterized by a series (two or more) of higher pivot lows, and higher pivot highs. Stage 3 is initiated by a break of major support. Downtrend is characterized by a series (two or more) of lower pivot highs, and lower pivot lows. Finally, markets transition into stage 1 after a break of major resistance.   


So far, we have been laying down a knowledge foundation. We will soon start incorporating all concepts into a tradable method. We have discussed support and resistance and how they relate to trends and trend changes. Strategies will be covered next.


Sunday, April 10, 2011

6. Forex market stages

Markets are in their essential nature fractals. The Wikipedia definition of a fractal is as follow: “A fractal is a rough or fragmented geometric shape that can be split into parts, each of which is (at least approximately) a reduced-size copy of the whole”. No matter what time-frame you are looking at, the basic unit of a market is comprised of four stages. These stages always repeat themselves in the same sequence and are the key to correctly determining the overall direction of the market. 


The first step of your forex market analysis is to make a correct decision whether to buy or sell a given currency. The key to determining market direction correctly is knowing the market stage of a given time-frame you plan on trading. Each stage has its own characteristics and requires different trading approach. For example, profitable strategy for stage 2, could be deadly in stage 1&3 and so on. Let`s now have a closer look at the individual stages.


Stage 1: Accumulation phase
Actions allowed:  Buy and Sell
This stage follows after a severe downtrend (stage 4), which is usually characterized by extreme fear. A lot of traders are short entering into stage 1. Smart money is covering their remaining short positions by buying from the dwindling supply of terrified sellers. Characteristic emotions for this market environment are uncertainty and ambivalence. Sellers are losing dominance quickly and bulls are gaining momentum. Both buyers and sellers are in a relative equilibrium. On a chart, the first hint of the beginning stage 1 is a break of major resistance (refer to support and resistance section). Usually, range bound trading follows. During a stage 1, a seasoned trader looks to buy in the area of support and looks to sell in the area of resistance.


Stage 2: Uptrend
Actions allowed: Buy only!
During accumulation phase (Stage 1), professional traders are usually getting out of their short positions and are starting to accumulate the currency from the shrinking number of available sellers.  Both active buying and shorts covering significantly increase demand, which leads to higher prices.  Markets enter into stage 2 uptrend, when bulls gain dominance and are able to push prices beyond the range bound trading characterized in stage 1. The dominant emotion for stage 2 is greed.  It is also a stage, when it is easiest for an average trader to make money. On a chart, the stage 2 is characterized by a series of higher lows and higher highs. During a stage 2, seasoned trader looks to buy on corrections.  


Stage 3: Distribution
Actions allowed: Buy and sell.
As stage 2 uptrend progresses, professional traders with long positions, start taking profits by selling. As more and more participants have already bought and the price is still higher, there are less and less available buyers remaining.  Eventually, the market reaches a point, when there are no more buyers left to buy at still higher prices. A sell off follows and when there is a break of major support, the market enters stage 3 distribution phase. This market environment is characterized mostly by uncertainty similarly as stage 1. Sometimes stage 3 transforms into a stage 4 downtrend rather quickly. During a stage 3, seasoned trader focuses on buying support and selling resistence. 


Stage 4: Downtrend
Actions allowed: Sell only!
Stage 4 completes the entire cycle. After a break of major support, we can consider stage 2 uptrend over. At this time, the pros are closing their longs and are getting ready to position themselves short for the upcoming downtrend. When supply totally overwhelms demand, the market takes a huge fall. Emotion dominating the market at this time is fear. Stage 4 usually lasts shorter and is more severe than stage 2 uptrend. The reason is that fear is more powerfully motivating emotion than greed.  On a chart, the stage 4 is characterized by a series of lower lows and lower highs. During a stage 4, seasoned trader looks to sell on corrections.  


As mentioned previously, understanding and using the concept of stages correctly is a key to determining the overall direction of any given market. However, experience is needed to make the proper distinctions. For example, what happens when market starts moving sideways? Assuming the previous move was up, are we now in stage 3? Or are we dealing with a correction within a stage 2 uptrend? A good rule of thumb is: “Market enters a stage 3 after a break of major support”.  In order to further deepen your knowledge of technical analysis, read a book called: “Elliot wave principle” written by A.J. Frost. The book will provide you with a valuable insight into the types of price corrections allowing you to make further disticntions.


Wednesday, April 6, 2011

5. Candles: Combinations

With two candles combinations, we have to look at both bullish and bearish patterns. Similarly as with individual candles, the names of the combinations are not as important as is the message that they are communicating.  In this blog, we will look at the following combinations:


Harami Cross and Harami are both considered to be reversal patterns and are characterized by small body candles or dojis appearing inside a previous large body candles. These combinations are especially significant after multi bar moves in one direction. Wide body (WB) candles have a tendency to either ignite a new move or terminate it.  For example, WB green candle following a multi bar move higher hints that bulls may be little overextended to the upside and the likelihood of at least temporary correction increases. If the following candle closes with a small real body inside the WB green candle (Harami pattern), we have a first hint of the underlying change in momentum.


As with Harami patterns, the remaining combinations covered in this blog are more potent primarily after significant moves in one direction. For example, if a bearish engulfing pattern develops after a multi bar move higher, it communicates weakling power of bulls. Engulfing is the strongest reversal pattern out of the three. Thurst line is the weakest, because the second candle in this combination does not even retraces half of the first candle. In a piercing line pattern, the second candle retraces more than half of the real body of the first candle. As with all the candles, both individual and combinations, it is important to consider whether the previous candles were moving up or down. Know the overall context of the market and never based entry decision on candlestick patterns alone. 


This blog offers basic understanding of candlestick patterns. To get a deeper knowledge a further study is required. I recommend reading a book from Steve Nison: "Beyond Candlesticks". Through candlesticks, we can spot early shifts in momentum, which can lead to price reversals. Candles will not guarantee a winning trade, but understanding them and using them correctly will increase the odds of successful trading.


Friday, March 25, 2011

4. Individual Candles


This post of the Forex Trading Mastery blog deals with different types of individual candles. It is not important for you to know names, but it helps to be familiar with various candle`s structures to spot early shifts in forex market momentum. 


First, we will look at dojis, which are candles with open and close at or very near the same price. Once a doji is closed, it communicates a balance of power between buyers and seller. Doji may be especially significant during strong trending moves, when one side usually dominates the market. The probability of a correction increases as markets move sharply in one direction. Dojis may be the first warning signs that the power between buyers and sellers is shifting. 


It is important to consider individual candles in the overall market trend. We should never base trading decisions on candles alone. However, individual candles can give us early signs of slowing price momentum, and potential increase in buying and selling. Individual candles are very meaningful after multiple bars moves in one direction. For example, shooting star after a multiple bar move up suggest a potential distribution and move down is likely to follow.


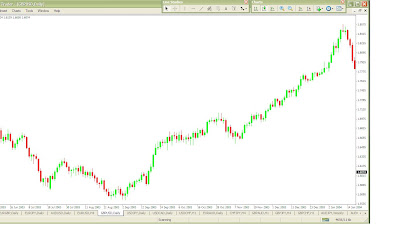
The goal is to learn to read the psychology behind candles. Let`s analyze our shooting star candle after a multiple bar move higher. Below, you can see a daily chart of GBP/USD. The chart is in a strong uptrend (we will be discussing trends shortly). The trend was temporarily halted by a shooting star and a sell off followed. The shooting star occurred on January 12, 2004. On that day, the market opened at 1.8472 and during the day rallied to 1.8581 (over 100 pips move). Then sellers hit the market with force and bulls were not even able to defend their opening price. The bar was giving us an early clue about the increasing strength of sellers. If you were long, it would be a signal to reduce or liquidate (depending on your trading strategy) your long positions.  


What are your top trading questions? If you could have a lunch with me, what are the top two questions you would ask about trading? Please, email me at pavel.ordos@foreksy.com. I will read all your emails and respond back.

Get a deeper understanding of the psychology behind candlesticks by studying Greg Capra`s "Mastering Candlestick Charts" DVD.   


Tuesday, March 22, 2011

3. Candles


By now, you should have an access to a forex demo account and a pre-set template for viewing charts (“pristine chart”). We will be covering fundamentals of technical analysis, which will allow you to read charts. Technical analysis studies price movements and provides strategies to enter in and out of trades. Through charts, we can read the overall emotional tone of a given market. You will learn to profit from understanding the dominant emotions experienced by the majority of traders. Technical analysis can be used virtually in any market (stocks, bonds, commodities, currencies). The principles are always the same.

We will be using Japanese candlestick charts. They do not offer any extra information compared to bar charts, but provide a visual picture of what is occurring at any given moment. Candles allow us to read other trader`s expectations on an ongoing basis. As you can see below, each candle shows 4 pieces of raw market data: open, close, high, and low. Green candle is a bull candle, meaning the market went up in value during a given period. Red candle is a bear candle, meaning the market went down in a given period. Depending on the time-frame you are looking at, each candle represents a period of time such as one hour, four hours, one day, one week, and so on.


Now, let`s examine the structure of a candle. Each candle has a body, which is the difference between the open and the closing prices. The part on either side of the body is called shadow, wick, or tail. Tails show us the maximum and minimum prices for a given period. There are many candlestick patterns both bullish and bearish. We will be discussing the different individual candles, two-candle patterns, and three candle patterns. However, to gain deeper understanding read book from Steve Nison. Below is a link to Amazon bookstore. If you will be buying it from Amazon, please, use this link. You can also find this book at Barnes&Nobel.

Open a daily pristine chart of EUR/USD and email me (pavel.ordos@foreksy.com) the open, close, high, and low prices for the following dates: November 27th, 2009; June 7th, 2010; November 4th, 2010; and January 11th, 2011. I will email you back my reading list.

" It is our duty to proceed as though the limits of our abilities do not exist."  - Pierre Teilhard De Chardin